Post by marchesarosa on Mar 18, 2011 20:21:55 GMT 1
Kevin Trenberth to Michael Mann, Oct 12, 2009:
The fact is that we can’t account for the lack of warming at the moment and it is a travesty that we can’t. The CERES data published
in the August BAMS 09 supplement on 2008 shows there should be even more warming: but the data are surely wrong.
Our observing system is inadequate.
Kevin Trenberth to Tom Wigley, Oct 14, 2009
Hi Tom How come you do not agree with a statement that says we are no where close to knowing where energy is going
or whether clouds are changing to make the planet brighter. We are not close to balancing the energy budget.
The fact that we can not account for what is happening in the climate system makes any consideration of geoengineering
quite hopeless as we will never be able to tell if it is successful or not! It is a travesty! Kevin
Leo Tolstoy
“I know that most men, including those at ease with problems of the greatest complexity, can seldom accept
even the simplest and most obvious truth if it be such as would oblige them to admit the falsity of conclusions which they
have delighted in explaining to colleagues, which they have proudly taught to others, and which they have woven, thread by thread,
into the fabric of their lives.”
Phil Jones
“We have 25 or so years invested in the work. Why should I make the data available to you, when your aim is to
try and find something wrong with it.” -
Phil Jones to Michael Mann Feb 21, 2005:
The IPCC comes in for a lot of stick. Leave it to you to delete as appropriate ! Cheers Phil PS I'm getting hassled by a couple of people
to release the CRU station temperature data. Don't any of you three tell anybody that the UK has a Freedom of Information Act !
Tom Wigley to Phil Jones Sep 27, 2009:
If you look at the attached plot you will see that the land also shows the 1940s blip (as I'm sure you know).
So, if we could reduce the ocean blip by, say, 0.15 degC, then this would be significant for the global mean — but we'd still
have to explain the land blip. I've chosen 0.15 here deliberately. This still leaves an ocean blip, and i think one needs to have
some form of ocean blip to explain the land blip (via either some common forcing, or ocean forcing land, or vice versa, or all of these).
When you look at other blips, the land blips are 1.5 to 2 times (roughly) the ocean blips — higher sensitivity plus thermal inertia effects.
My 0.15 adjustment leaves things consistent with this, so you can see where I am coming from. Removing ENSO does not affect this.
It would be good to remove at least part of the 1940s blip, but we are still left with "why the blip". Let me go further.
If you look at NH vs SH and the aerosol effect (qualitatively or with MAGICC) then with a reduced ocean blip we get continuous warming
in the SH, and a cooling in the NH — just as one would expect with mainly NH aerosols. The other interesting thing is
(as Foukal et al. note — from MAGICC) that the 1910-40 warming cannot be solar. The Sun can get at most 10% of this with Wang et al solar,
less with Foukal solar. So this may well be NADW, as Sarah and I noted in 1987 (and also Schlesinger later). A reduced SST blip in the 1940s
makes the 1910-40 warming larger than the SH (which it currently is not) — but not really enough. So ... why was the SH so cold around 1910?
Another SST problem? (SH/NH data also attached.) This stuff is in a report I am writing for EPRI, so I'd appreciate any comments you
(and Ben) might have. Tom.
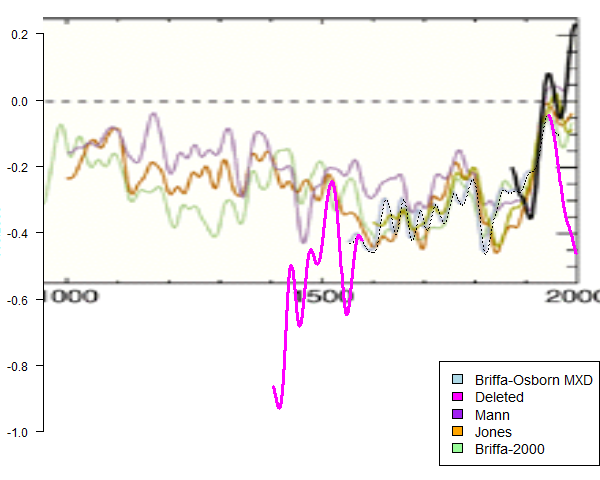
Tim Osborn to Michael Mann and Ian Macadam , Oct 5, 1999:
Dear Mike and Ian Keith has asked me to send you a timeseries for the IPCC multi-proxy reconstruction figure, to replace
the one you currently have. The data are attached to this e-mail. They go from 1402 to 1995, although we usually stop the series
in 1960 because of the recent non-temperature signal that is superimposed on the tree-ring data that we use. I haven't put
a 40-yr smoothing through them - I thought it best if you were to do this to ensure the same filter was used for all curves.
Keith Briffa:
Briffa: For the record, I do believe that the proxy data do show unusually >warm conditions in recent decades.
I am not sure that this unusual warming >is so clear in the summer responsive data. I believe that the recent warmth
>was probably matched about 1000 years ago. I do not believe that global >mean annual temperatures have simply cooled
progressively over thousands of >years as Mike appears to and I contend that that
there is strong evidence >for major changes in climate
over the Holocene (not Milankovich) that >require explanation
and that could represent part of the current or future >background variability of our climate. I think the Venice meeting
will be >a good place to air these isssues.
The fact is that we can’t account for the lack of warming at the moment and it is a travesty that we can’t. The CERES data published
in the August BAMS 09 supplement on 2008 shows there should be even more warming: but the data are surely wrong.
Our observing system is inadequate.
Kevin Trenberth to Tom Wigley, Oct 14, 2009
Hi Tom How come you do not agree with a statement that says we are no where close to knowing where energy is going
or whether clouds are changing to make the planet brighter. We are not close to balancing the energy budget.
The fact that we can not account for what is happening in the climate system makes any consideration of geoengineering
quite hopeless as we will never be able to tell if it is successful or not! It is a travesty! Kevin
Leo Tolstoy
“I know that most men, including those at ease with problems of the greatest complexity, can seldom accept
even the simplest and most obvious truth if it be such as would oblige them to admit the falsity of conclusions which they
have delighted in explaining to colleagues, which they have proudly taught to others, and which they have woven, thread by thread,
into the fabric of their lives.”
Phil Jones
“We have 25 or so years invested in the work. Why should I make the data available to you, when your aim is to
try and find something wrong with it.” -
Phil Jones to Michael Mann Feb 21, 2005:
The IPCC comes in for a lot of stick. Leave it to you to delete as appropriate ! Cheers Phil PS I'm getting hassled by a couple of people
to release the CRU station temperature data. Don't any of you three tell anybody that the UK has a Freedom of Information Act !
Tom Wigley to Phil Jones Sep 27, 2009:
If you look at the attached plot you will see that the land also shows the 1940s blip (as I'm sure you know).
So, if we could reduce the ocean blip by, say, 0.15 degC, then this would be significant for the global mean — but we'd still
have to explain the land blip. I've chosen 0.15 here deliberately. This still leaves an ocean blip, and i think one needs to have
some form of ocean blip to explain the land blip (via either some common forcing, or ocean forcing land, or vice versa, or all of these).
When you look at other blips, the land blips are 1.5 to 2 times (roughly) the ocean blips — higher sensitivity plus thermal inertia effects.
My 0.15 adjustment leaves things consistent with this, so you can see where I am coming from. Removing ENSO does not affect this.
It would be good to remove at least part of the 1940s blip, but we are still left with "why the blip". Let me go further.
If you look at NH vs SH and the aerosol effect (qualitatively or with MAGICC) then with a reduced ocean blip we get continuous warming
in the SH, and a cooling in the NH — just as one would expect with mainly NH aerosols. The other interesting thing is
(as Foukal et al. note — from MAGICC) that the 1910-40 warming cannot be solar. The Sun can get at most 10% of this with Wang et al solar,
less with Foukal solar. So this may well be NADW, as Sarah and I noted in 1987 (and also Schlesinger later). A reduced SST blip in the 1940s
makes the 1910-40 warming larger than the SH (which it currently is not) — but not really enough. So ... why was the SH so cold around 1910?
Another SST problem? (SH/NH data also attached.) This stuff is in a report I am writing for EPRI, so I'd appreciate any comments you
(and Ben) might have. Tom.
Tim Osborn to Michael Mann and Ian Macadam , Oct 5, 1999:
Dear Mike and Ian Keith has asked me to send you a timeseries for the IPCC multi-proxy reconstruction figure, to replace
the one you currently have. The data are attached to this e-mail. They go from 1402 to 1995, although we usually stop the series
in 1960 because of the recent non-temperature signal that is superimposed on the tree-ring data that we use. I haven't put
a 40-yr smoothing through them - I thought it best if you were to do this to ensure the same filter was used for all curves.
Keith Briffa:
Briffa: For the record, I do believe that the proxy data do show unusually >warm conditions in recent decades.
I am not sure that this unusual warming >is so clear in the summer responsive data. I believe that the recent warmth
>was probably matched about 1000 years ago. I do not believe that global >mean annual temperatures have simply cooled
progressively over thousands of >years as Mike appears to and I contend that that
there is strong evidence >for major changes in climate
over the Holocene (not Milankovich) that >require explanation
and that could represent part of the current or future >background variability of our climate. I think the Venice meeting
will be >a good place to air these isssues.