|
|
Post by marchesarosa on Sept 29, 2012 3:51:51 GMT 1
|
|
|
|
Post by marchesarosa on Sept 29, 2012 4:04:19 GMT 1
Wonder what nickrr thinks of this?
|
|
|
|
Post by marchesarosa on Oct 1, 2012 11:00:27 GMT 1
As the Arctic ice reached its lowest summer extent in September, supposedly because of the polar amplification of anthropogenic global warming caused by CO2, this was happening in Iceland. The "open" Arctic Ocean is producing more snow. This was on 13th September, remember! www.youtube.com/watch?v=mVEXreQirrk&feature=player_embedded |
|
|
|
Post by marchesarosa on Oct 1, 2012 11:26:09 GMT 1
Here is Herman Alexander Pope's Hypothesis about the possibility of the Arctic Ocean being the global thermostat determining the transition from glacial to interglacial and back again. I sum it up thus, when the Arctic Ocean is "open" (ice-free) it snows like mad, ice builds in the Northern Hemisphere and the world gets colder. Since it then also gets drier as it freezes there is less snowfall. The ice then gradually sublimates and melts from exposure to sunshine and it gets warmer. And so on. Seems like there might be a grain of truth in this hypothesis. The experience of the Icelandic weather featured in the previous post certainly seems "consistent" with the open Arctic Ocean causing more precipitation in the form of snow. Anyway I think Pope is worth a read! Not because it is TRUE but because it is interesting and touches on the paradoxes of climate and weather. popesclimatetheory.com/index.html |
|
|
|
Post by marchesarosa on Oct 1, 2012 11:56:24 GMT 1
Here is another graph of Arctic Ocean sea ice change. Unlike the others this shows the 30% minimum ice cover for the whole year. It was at it's lowest this summer since 1979 but it was also higher than recent years in the late Winter and Spring. Winter sea ice extent is, of course, constrained by the land which surrounds most of the Great Polar Basin. (I like that term, it expresses the uniqueness of the Arctic Ocean which is small, as oceans go, and not very deep as ocean go, more like a puddle at the top of the world.) 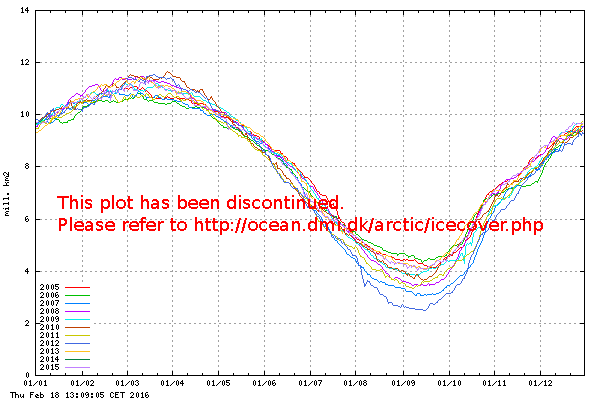 Danish Meteorological Institute (DMI) – Centre for Ocean and Ice |
|
|
|
Post by nickrr on Oct 1, 2012 20:35:28 GMT 1
Note though that the percentage difference in late winter was only a few percent whereas the the difference over the last month or so is much greater (30 - 40%). The summer difference is therefore much more significant.
|
|
|
|
Post by marchesarosa on Oct 8, 2012 19:37:26 GMT 1
 In the Arctic it's global warming. In the Antarctic is just "local phenomenon". Figures! |
|
|
|
Post by marchesarosa on Nov 6, 2012 17:15:04 GMT 1
The extension of all Arctic and Antarctic sea ice has only been monitored in a systematic way since the onset of satellite observations in late 1978.... Before November 1978 observations were more local and regional, and many of the overall details are not known. As an example, the tragic loss of Hans Hedtoft in 1959 became the stimulus to initiate Danish airborne observations of sea ice around southern Greenland. 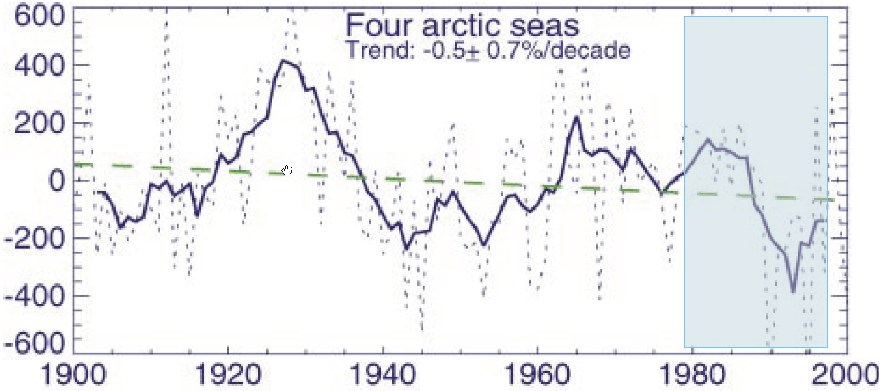 Time series showing the August ice-extent anomalies (x 1000 km2) in the Arctic Ocean along the coast of Russia, Siberia and Alaska: The Kara Sea, the Laptev Sea, the East Siberian Sea, and Chuckchi Sea (Polyakov et al. 2003). The composite record show large sea ice variations around a small negative trend since 1900, although the trend from a statistical point of view is not significant (Polyakov et al. 2003). The blue area to the right shows the time extent of the satellite-era. Time series showing the August ice-extent anomalies (x 1000 km2) in the Arctic Ocean along the coast of Russia, Siberia and Alaska: The Kara Sea, the Laptev Sea, the East Siberian Sea, and Chuckchi Sea (Polyakov et al. 2003). The composite record show large sea ice variations around a small negative trend since 1900, although the trend from a statistical point of view is not significant (Polyakov et al. 2003). The blue area to the right shows the time extent of the satellite-era.To obtain knowledge on Arctic sea ice extent in a longer time perspective, Polyakov et al. (2003) analysed the Russian historical records of Arctic sea ice extent and thickness extend back to the beginning of the twentieth century. Occasional ship observations of summer ice edge started in the first decade of the 1900s when the first Russian hydrographic surveys and commercial shipping routes along the Siberian coast began. Starting in 1929, when the Soviet Polar Aircraft Fleet was created, aircraft-based observations began, which improved the quality of the data substantially. However, systematic aircraft and ship observations of sea ice from the Kara Sea to the Chukchi Sea only began in 1932, when the Northern Sea Route was opened by the ship Sibiryakov. There were information gaps 1942-1945 because of World War II. The missing data were reconstructed using statistical (regressionlike) models relating atmospheric processes to ice extent. Aircraft ice-edge observations continued until 1979, when the satellite era began, but until recently a combination of satellite and aircraft summer ice-edge observations was used. Since 1990 all ice-extent observations have been satellite based. Based on these observational data, Polyakov et al. (2003) concluded that the “examination of records of fast ice thickness and ice extent from four Arctic marginal seas (Kara, Laptev, East Siberian, and Chukchi) indicates that long-term trends are small and generally statistically insignificant, while trends for shorter records are not indicative of the long-term tendencies due to strong low-frequency variability in these time series, which places a strong limitation on our ability to resolve long-term trends”. “Correlation analysis shows that dynamical forcing (wind or surface currents) is at least of the same order of importance as thermodynamical forcing for the ice extent variability in the Laptev, East Siberian, and Chukchi Seas ”  Figure 2 in Vinje (2001), showing the reduction in April sea ice extent in the Nordic Seas since 1864. Nordic Seas (NS), eastern area (E), and western area (W) time series given by 2-yr running mean and regression lines. Linear year-to-year interpolations of the ice extent have been made for the western area for 1940 and 1944–46, and for the eastern area for 1868–70, 1874–78, 1880, 1892, 1894, 1940–41, 1943–48, and 1961. The blue area to the right shows the time extent of the satellite-era shown in the figure higher up in this paragraph. Apparently, much of the sea ice reduction in this region occurs in concert with the termination of the Little Ice Age and the following warming during the 20th century. Click here to read a few reflections on this overall theme. Figure 2 in Vinje (2001), showing the reduction in April sea ice extent in the Nordic Seas since 1864. Nordic Seas (NS), eastern area (E), and western area (W) time series given by 2-yr running mean and regression lines. Linear year-to-year interpolations of the ice extent have been made for the western area for 1940 and 1944–46, and for the eastern area for 1868–70, 1874–78, 1880, 1892, 1894, 1940–41, 1943–48, and 1961. The blue area to the right shows the time extent of the satellite-era shown in the figure higher up in this paragraph. Apparently, much of the sea ice reduction in this region occurs in concert with the termination of the Little Ice Age and the following warming during the 20th century. Click here to read a few reflections on this overall theme. For sea ice in the Nordic Seas the Norwegian scientist Torgny Vinje (Vinje 2001) has done the painstaking work of collecting observations made by ships since 1864. In the Nordic Seas the maximum extent of ice (April, se diagram above) has decreased around 33% since 1864, demonstrating that the reduction is not a new phenomena, but began long ago. Nearly half the observed reduction actually took place between 1860 and 1990 (Vinje 2001). While the mean annual reduction of the April ice extent has been decelerating by a factor of 3 between 1880 and 1980, the mean annual reduction of the minimum (August) ice extent is proceeding linearly (Vinje 2001). Click on sea ice in lefthand margin list here www.climate4you.com/ |
|
|
|
Post by marchesarosa on Nov 6, 2012 17:52:32 GMT 1
If you are wondering what is the purpose of the two graphs above it is to show that the gradual reduction in Arctic Sea ice is of long duration, going back to the end of the Little Ice Age and is not of a recent date.
|
|
|
|
Post by nickrr on Nov 7, 2012 15:07:35 GMT 1
Both these graphs stop on or before 2000 so they don't show the recent more dramatic decreases in sea ice. They are at best useless and worst dishonest.
|
|
|
|
Post by marchesarosa on Nov 7, 2012 15:55:58 GMT 1
from 2000 to 2012 is only a continuation of the same longterm trend.
You really don't like data which debunks your CO2 alarmism, do you, nickrr?
The two graphs above both show the reduction in sea ice coincident with the warming we know happened in the 1920s and 1930 and also the increased ice during the global mid century dip in temperatures from about 1945 to 1975.
Pretty convincing data I would say. Oscillations round a downward trend describes it nicely. Do YOU have any data which shows anything different, nickrr?
|
|
|
|
Post by nickrr on Nov 8, 2012 8:37:28 GMT 1
Wrong. The minimum sea ice in recent years has been 40-50% below the average for the previous 20 years: nsidc.org/arcticseaicenews/This is a much steeper decline in sea ice than your graphs show. |
|
|
|
Post by marchesarosa on Nov 8, 2012 10:13:15 GMT 1
Whether the slope of the trend changes or not the overall trend itself is clearly downward from the end of the Little Ice Age in the mid 19th century. That is when the glaciers started retreating again after growing during the Little Ice Age.
Are you disputing the veracity of the graphs, nickrr?
You should note that the graphs are for the months of August and April respectively. They do not purport to deal with the minimum ice extents which have got alarmists wetting themselves recently.
The fact that both graphs show an oscillation around a declining trend is what serious observers of climate rather than the alarmist tendency expect to see given the domination of natural cycles in these phenomena.
Alarmists who limit their observations to the satellite period only are hardly displaying true scientific curiosity.
|
|
|
|
Post by marchesarosa on Nov 8, 2012 20:20:11 GMT 1
Just for comparison, here is another oscillation round a trend. This time it's the HadCRUT3 global mean temperature data showing a positive slope of of 0.41 degreesC per century. Very "alarming" I must say!  |
|
|
|
Post by marchesarosa on Nov 8, 2012 20:25:49 GMT 1
and here is the latest UAH satellite temp anomaly data from 1979 just for fun! 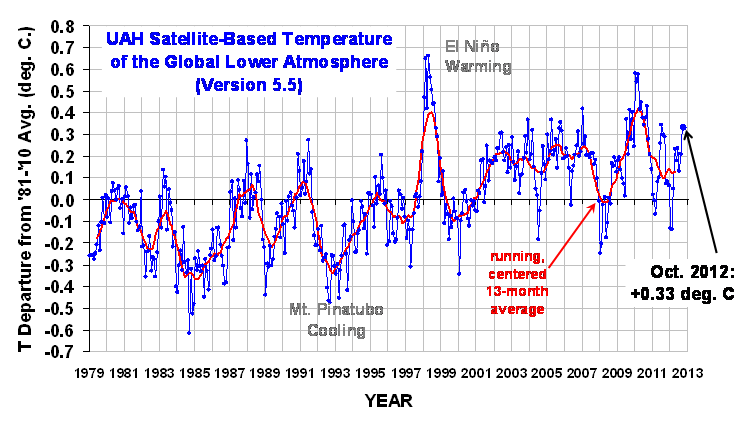 |
|


