More Musings from Chiefio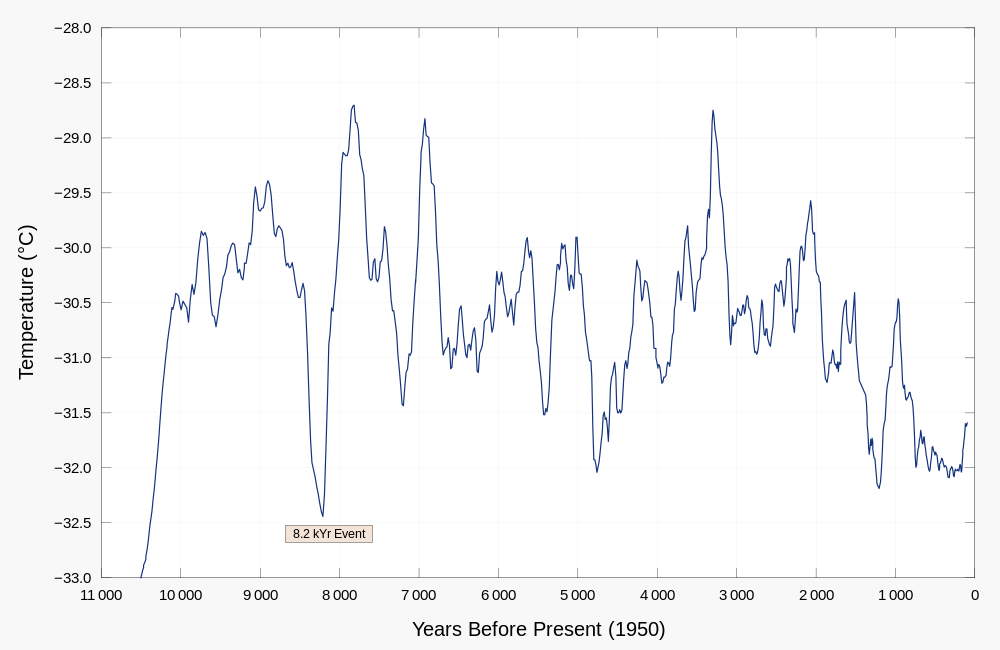
I find this to be an interesting graph. For several reasons. We’ll go through them one at a time. There will be several mentions of bits of history that we’ve talked about before. If I get time I may put in links to the particular articles, but for now you get to use the search box or the ‘by topic’ categories on the right side of the page… Random quoted text will be from a wiki about a given empire or event.
First up, some general points.
1) Our last 500 years of temperatures have been extraordinarily stable. This graph ends in 1950 (as it takes time for ice on the surface to seal and form a usable layer) and it was modestly warm in the 1934-50 range. Folks quibble over the question of ‘was 1934 the hottest or 1998′; for our purposes, all we care about is that it was ‘about the same’. So look at that little 500 year tail on the dog. Darned near flat compared to the rest of the graph. 1500 AD to date covers the rise out of the little ice age. Something that we frequently talk about as a major temperature swing. It isn’t, in the context of 11,000 years.
2) There is no “Hockey Stick” here. We have a generally ’rounding over’ series that was higher in the past and is slowly turning into a downtrend from about 1000 BC ( 3000 BP ) to date. Run your eye from peak to peak and visually add in the hoop over the top, the upper bound trend arc.
3) Things were incredibly volatile in the past. There are spikes and drops of 2 C regularly and some over 3 C in 50 to 100 year (or less) ranges. While there were civilizations that rose in good times and fell in cold times in sync with those spikes. I think “this matters”. We HAVE climate change, and even catastrophic climate change. It just isn’t caused by people and it has nothing to do with CO2. It happens, and has happened, all on its own. You can find the start of The Dark Ages at that first big plunge about 1500 BP / 500 AD when The Roman Warm Period ends. There is the rise and fall of the Akkadian Empire from 3000 BC to 2145 BC (5000 BP to 4145 BP) “Urban populations there had peaked already by 2,600 BC ” which is that peak rising just after 5000 BP on the graph.
The water table in this region was very high, and replenished regularly—by winter storms in the headwaters of the Tigris and Euphrates from October to March, and from snow-melt from March to July. Flood levels, that had been stable from about 3,000 to 2,600 BC, had started falling, and by the Akkadian period were a half-meter to a meter lower than recorded previously.
That is 5,000 BP to 4600 BP. So there was a period of good rains, then things began drying. By 4600 BP the population had peaked. The Akkadian empire takes over and rises during the warming and then collapses in the next dip.
4) It was much warmer in the past. On many occasions. Remember that this is the Greenland temperature. All that worry about how Greenland is going to melt away due to our “unprecedented” warming? Well, I count 3 peaks of about 2.5 C higher than ‘now’ and almost the entirety of the graph is above ‘now’. We’re in a cold time, not a warm time. Yes, the Little Ice Age was colder. So?
5) There have been some VERY sharp cold spikes in the past. One of them could ruin your whole day. They tend to land on periods of history that were commonly called “Pessimums”. The warm times were commonly called “optimums” (as times were good then for people.) See the Roman Era Optimum leading into that peak at 2000 BP (then that Christ guy came along and the whole Republic has some issues on that dip, warming after to about 400 AD when the Roman Optimum ended, and the Roman Empire with it…)
6) The right margin shows a dramatic rise out of the 12,000 BP or so range. We know that Golbeki Tepe was built during a very much colder time. Clearly that society was fairly advanced (at least they new how to carve rock well). It looks like The Flood will date from about that time, when the glacial ice sheets were melting under very fast warming.
7) Something interesting happened 8.2 kiloyears ago (it’s called the 8.2 Kiloyear Event).
8) Civilization was disrupted from that 12,000 BP prior civilization until about 4,000 BC, or 6,000 BP on the graph. The volatility is greatest, with the most massive swings and the the least stable runs, during that 12,000 BP to 6,000 BP window. Hard to recover when you have just had a global flood, ice sheet collapse, undoubtedly disrupted weather systems, and no stability. At that 6,000 to 5,000 BP window of stability, human history as we know it begins.
9) Sumer begins about 4500 to 4100 BC ( 6500 BP to 6100 BP). Just when we get that bit of stability. The earliest farming seems to start about 5000 BC in that area. Just after that 7000 BP spike of warmth and the stability shelf that follows it. It would be hard to farm in the violent swings before that (not impossible, just a bit hard) and much easier afterwards. With few surviving people after the flood collapse, hunting would the easy. I suspect that the warm 8000 BP to 7000 BP (despite one spike down) would have given time for populations to grow and villages to expand to the point where starting to farm would make sense. Sumer was top dog in the area until about 2200 BC / 4200 BP when the Akkadians took over (right after that ‘dip’ at about 4600 BP.
10) That dip at 4600 BP is called the Piora Oscillation “The cause or causes of the Piora Oscillation are debated. A Greenland ice core, GISP2, shows a sulfate spike and methane trough c. 3250 BC, suggesting an unusual occurrence — either a volcanic eruption or a meteor or an asteroid impact event. Other authorities associate the Piora Oscillation with other comparable events, like the 8.2 kiloyear event, that recur in climate history, as part of a larger 1500-year climate cycle.” Ötzi the Iceman fell in about 5300 BP, just as THAT warm peak turned into this drop, covering him in ice for the next 5000 years.
10) At about 4,600 BP / 2,600 BC we get the Egyptian Old Kingdom. That happens on that nice warm rise just as we head out of the 5,000 BP dip (they seem to grow through the Piora Oscillation, then flower to empire in the aftermath of Sumer falling). Just as we rise out of that dip: “Old Kingdom is the name given to the period in the 3rd millennium BC when Egypt attained its first continuous peak of civilization in complexity and achievement” So things were a bit disrupted before that. Oh, yeah, the dip… They end in the next dip about 4200 BP. That’s not a very good time “The First Intermediate Period, often described as a “dark period” in ancient Egyptian history, spanned approximately one hundred years after the end of the Old Kingdom from ca. 2181-2055 BC.”
11) What happens in the nice warming ramp about 1500 BC? Say about 3700 BP to 3400 BP? This nice list of empires says “1500 BC Olmec” and “1700 BC Shang Dynasty”. In 1400 BC 3400 BP it has “c. 1400 BC: Expansion and Contraction of Mesopotamian Empires” and the chart does have a bit of wobble about then. What about that peak at about 4200 BP / 2200 BC? Anything interesting? “2205 BC: Early Chinese Civilization” Hmmm…. On a ‘someday list’ is to do a much more complete map of empires against that graph. For now it’s pretty clear that the classical empires fall on the down spikes, new ones form on the rising warm periods. Instability is bad, stability is better.
12) The Dark Ages and the Little Ice Age were no great shakes for our civilization. IMHO, the only thing that saved us was that long flat stable time from about 1300 when the Renaissance could develop, then our modern warming when we could turn that into an industrial age.
more
chiefio.wordpress.com/2011/12/13/8-2-kiloyear-event-and-you/

