|
|
Post by marchesarosa on Apr 11, 2012 11:42:34 GMT 1
Here's a plot of proxy measures of CO2 from bubbles in ice cores from EPICA dome C in Antarctica (red line) back to the end of the last glaciation, i.e the duration of the holocene, our current interglacial period. Above it (blue line) is a plot of the temperature divined from Greenland ice-cores. No match.  Source:U.S. National Oceanic and Atmospheric Administration (NOAA): GISP 2 and EPICA Dome C: The ice core data show that CO2 in Antarctica started to rise 6,000 years ago NOT at the start of industrialisation. Why? Probably because of plant growth (respiration), ice-melt and ocean warming (outgassing). But no-one knows, really. It's speculation. Michael Pacnik states: .....the most recent rise in CO2 is not shown in the preceding because the EPICA ice core data ends in 1777 A.D., while the GISP 2 ice core temperature data extends up to a century ago... .....7000 to 8000 years ago was particularly warm... the Holocene Climate Optimum. Research at Oak Ridge National Laboratory remarks “By 8,000 (years ago according to carbon 14 levels) the Earth was under a full interglacial climate, with conditions warmer and moister than present in many parts of the world. Tropical forest in Africa (and probably also Asia) was expanded in area, and the areas of desert in Africa and Asia were much reduced.”more here wattsupwiththat.com/2012/04/11/does-co2-correlate-with-temperature-history-a-look-at-multiple-timescales-in-the-context-of-the-shakun-et-al-paper/#more-61078 |
|
|
|
Post by StuartG on Jun 5, 2012 20:10:00 GMT 1
|
|
|
|
Post by marchesarosa on Jun 6, 2012 10:52:15 GMT 1
Spectacular misunderstanding by the BBC reporter, stu, of the nature of this experiment.
He kept saying we will *know* from this experiment what the level of CO2 will be 30 to 40 years into the future.
We will only know how much the ecosystem responds to CO2 fertilisation! We already know that, other things being equal, trees and everything else will grow bigger and faster with higher levels of CO2.
You and I could do a better job of presenting this research and interviewing the boffin than this prat did!
|
|
|
|
Post by marchesarosa on Jul 2, 2012 15:58:30 GMT 1
The Earth’s biosphere is booming, data suggests that CO2 is the cause The SeaWiFS instrument aboard the Seastar satellite has been collecting ocean data since 1997. By monitoring the color of reflected light via satellite, scientists can determine how successfully plant life is photosynthesizing. A measurement of photosynthesis is essentially a measurement of successful growth, and growth means successful use of ambient carbon. This animation shows an average of 10 years worth of SeaWiFS data. Dark blue represents warmer areas where there tends to be a lack of nutrients, and greens and reds represent cooler nutrient-rich areas which support life. The nutrient-rich areas include coastal regions where cold water rises from the sea floor bringing nutrients along and areas at the mouths of rivers where the rivers have brought nutrients into the ocean from the land. more here wattsupwiththat.com/2011/03/24/the-earths-biosphere-is-booming-data-suggests-that-co2-is-the-cause-part-2/and here CO2 Is Greening The Planet: African Savannahs Getting a Makeover to Forestswattsupwiththat.com/2012/07/02/co2-is-greening-the-planet-african-savannahs-getting-a-makeover-to-forests/
|
|
|
|
Post by marchesarosa on Aug 7, 2012 17:20:16 GMT 1
Earth’s Carbon Sink Still Strong and Growing As is widespread and common knowledge, higher atmospheric carbon dioxide (CO2) levels are beneficial to plants making them grow faster and larger, in addition to enhancing them in virtually every other way. For an immersion in the subject of plants and carbon dioxide, check out the website PlantsNeedCO2.org and revel in the good news concerning higher atmospheric CO2 levels. This growth enhancement has led to the earth’s plants taking an increasing amount of CO2 from the atmosphere and turning it into biomass where carbon is stored for days to hundreds of years (this mechanism accounts for a significant portion of the earth’s land-based carbon sink). It seems the more CO2 we pump into the atmosphere, the more CO2 that plants take out to enhance their growth. The oceans also take carbon dioxide out of the atmosphere and can store it for long periods of time (thousands of years). And it appears that this ocean carbon sink is also expanding as we emit more CO2 into the atmosphere. Together, the land and ocean carbon sinks have been pretty much keeping up with the increasing anthropogenic carbon dioxide emissions. Consequently, the percentage of CO2 injected into the atmosphere from human activities that remains in the atmosphere has remained pretty much constant for the last 50 years—according to just-published research in the journal Nature—despite ever increasing anthropogenic CO2 emissions. Figure 1, taken from the new paper by Ballantyne et al., shows the three main components of the CO2 budget. The top panel shows that the annual amount of CO2 that is staying in the atmosphere is slowly increasing. The middle panel shows the annual amount of CO2 that is emitted into the atmosphere each year from human activities (fossil fuel use and land use changes). Notice that the amount that remains in the atmosphere (top panel) is only about 45% of the amount that is emitted by humans (middle panel). This means that the other 55% is being taken up by land and ocean sinks. This increasing sink is shown in the bottom panel of Figure 1—note that the greater the negative value the greate the carbon sink.  Figure 1. (Top) Annual accumulation of CO2 in the atmosphere. (Middle) Annual CO2 emissions from anthropogenic activities. (Bottom) Net CO2 update by land an ocean sinks (from Ballantyne et al., 2012). If all of this seems a bit familiar, it is because we reported on a similar finding published about a year and a half ago in the journal Geophysical Research Letters by Wolfgang Knorr. But instead of just focusing on the past 50 years like Ballantyne et al. did, Knorr extended his analysis back 150 years, and concluded that the airborne fraction of carbon dioxide had remained constant over that longer period as well. Such results run counter to modeling studies which continue to suggest that the earth’s carbon sinks should be declining and that consequently, a growing percentage of anthropogenic CO2 emissions should be remaining in the atmosphere—acting of course to further enhance global warming. But the observations show that this just ain’t so. Recall what Knorr had to say in a press release accompanying his article: New data show that the balance between the airborne and the absorbed fraction of carbon dioxide has stayed approximately constant since 1850, despite emissions of carbon dioxide having risen from about 2 billion tons a year in 1850 to 35 billion tons a year now.
This suggests that terrestrial ecosystems and the oceans have a much greater capacity to absorb CO2 than had been previously expected.
The results run contrary to a significant body of recent research which expects that the capacity of terrestrial ecosystems and the oceans to absorb CO2 should start to diminish as CO2 emissions increase, letting greenhouse gas levels skyrocket. And now Ballantyne et al. add: From a global mass balance perspective, net uptake of atmospheric CO2 has continued to increase during the past 50 yr and seems to remain strong. Although present predictions indicate diminished [carbon] uptake by the land and oceans in the coming century, with potentially serious consequences for the global climate, as of 2010 there is no empirical evidence that [carbon] uptake has started to diminish on the global scale. [emphasis added –eds.] Both Knorr and Ballantyne et al. call for more research into just why observations show one thing and models project another (a characteristic that seemingly is ubiquitous in climate change research). What all of this means is that despite the pessimistic prognostications, the earth’s natural systems continue to mitigate the impacts of human fossil fuel utilization—a utilization which has vastly improved both our standard of living and our life expectancy. The earth is quite an extraordinary place! References: Ballantyne, A. P., 2012. Increase in observed net carbon dioxide uptake by land and oceans during the past 50 years. Nature, 488, 70-72, do:10.1038/nature11299 Knorr, W., 2009. Is the airborne fraction of anthropogenic CO2 emissions increasing? Geophysical Research Letters, 36, L21710, doi:10.1029/2009GL040613. -------- Discussion by Prof Pat Michaels at World Climate Report www.worldclimatereport.com/index.php/2012/08/02/earths-carbon-sink-still-strong-and-growing/ |
|
|
|
Post by marchesarosa on Sept 1, 2012 16:59:56 GMT 1
Latest Climatic research showing once again that CO2 rise lags temperature not vice versa. www.sciencedirect.com/science/article/pii/S0921818112001658The phase relation between atmospheric carbon dioxide and global temperatureby Ole Humlum, Kjell Stordahl and Jan-Erik Solheimd These are just academics based at Norwegian Geoscience, Geology and Technology Universities, so the usual "delusional" denier slobs you love to hate, nickrr. From the Abstract .... Ice cores show atmospheric CO2 variations to lag behind atmospheric temperature changes on a century to millennium scale, but modern temperature is expected to lag changes in atmospheric CO2, as the atmospheric temperature increase since about 1975 generally is assumed to be caused by the modern increase in CO2....
The maximum positive correlation between CO2 and temperature is found for CO2 lagging 11–12 months in relation to global sea surface temperature, 9.5-10 months to global surface air temperature, and about 9 months to global lower troposphere temperature. The correlation between changes in ocean temperatures and atmospheric CO2 is high, but do not explain all observed changes. The paper finds the “overall global temperature change sequence of events appears to be from 1) the ocean surface to 2) the land surface to 3) the lower troposphere,” in other words, the opposite of claims by global warming alarmists that CO2 in the atmosphere drives land and ocean temperatures. Instead, just as in the ice cores, CO2 levels are found to be a lagging effect of ocean warming, not significantly related to man-made emissions, and not the driver of warming. |
|
|
|
Post by marchesarosa on Oct 15, 2012 12:00:51 GMT 1
On the Coherence between Dynamics of the World Fuel Consumption and Global Temperature Anomalyby by L.B. Klyashtorin & A.A. Lyubushin 2003 www.biokurs.de/treibhaus/180CO2/Fuel_Consumption_and_Global_dT-1.pdf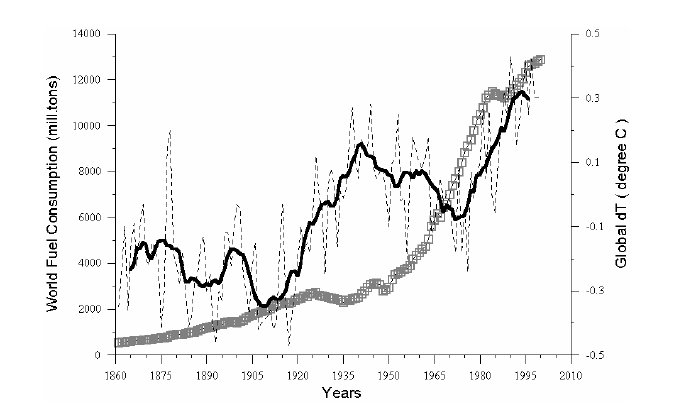 Figure 1. Comparative dynamics of the World Fuel Consumption (WFC) and Global Temperature Anomaly (dT) 1861–2000. Thin line – annual dT; Bold line – 13-years smoothing; Dashed line – WFC (mill. tons of nominal fuel). Between 1861-1875, both WFC and dT exhibited simultaneous, well-correlated growth. During 1875-1910, the dynamics of these indices were different. WFC continues to grow, while global dT decreases, which reflects in negative correlation between the indices. The next period, from 1910 to 1940, is of particular interest in this context. For these 30 years WFC shows virtually no increase because of the global economic crisis of 1920-30-s. However, dT in the same period increased by more than 0.4°. During the subsequent 35-years (1940-1975), WFC increased by a factor of 2.5 (from 3 to 7 billion tons.). For the same period, global dT did not increase, but decreased roughly by 0.12°C and negative correlation between the WFC and dT dynamics is characteristic of this time period. In the recent 25-year period (1975-2000), in accordance with the ascending phase of an alternate dT fluctuation (see Figure 1 and Table 1), a close positive correlation takes place between the dynamics of WFC and dT. Thus, on the background of monotonous increase in WFC during the last 140 years, global dT dynamics exhibited alternating 25-30-year periods of lowering or raising (with the corresponding alternation of positive or negative correlation between the WFC and dT trends). What changes in the dynamics of WFC and Global dT can we expect in the near future, between 2000-2030?Proceeding from the hypothesis of cyclic dynamics of global dT with a period of 50-60 years, we assume that the current "increasing" phase started in 1975 reached its maximum by 2000, then the gradual decrease in dT will start in the nearest few years and continue up to the 2030s. It should be mentioned that the 50-60-year period of the dT fluctuations has been derived from the time series of the instrumentally measured temperatures for the last 140 years "by eye" (Figure 1). This time period includes only 2.5 roughly 60-year cycles, and it is insufficient from an analytical perspective for a statistically rigorous conclusion on the cyclic character of the fluctuations and analysis of much longer time series required. Table 1 Global Temp change.....Period of observation.......Correlation Coeff between dT & WFC Ascending........................1861 - 1875..............................+0.92 Descending......................1875 - 1910...............................-0.71 Ascending........................1910 - 1940..............................+0.28 Descending......................1940 - 1975...............................-0.88 Ascending........................1975 - 2000..............................+0.94 Descending (?).................2000 - 2030..................................? ------------- This paper was written in 2003. We now know global mean temperature has plateaued out in the last 16 years to 2012 but that fossil fuel use has increased rapidly in the industrialising world. So it looks like proof that temperature is not related to the combusion of fossil fuels and associated emission of CO2. How very prescient of the authors to have made this accurate prediction on the basis of their understanding of the previously uncorrelated trends! Looks like the Null Hypothesis stands!
|
|
|
|
Post by marchesarosa on Dec 7, 2012 13:12:34 GMT 1
A problem: nearly one third of CO2 emissions occured since 1998, and it hasn’t warmedPosted on December 6, 2012 by Guest post by Tom Fullerwattsupwiththat.com/2012/12/06/a-problem-nearly-one-third-of-co2-emissions-occured-since-1998-and-it-hasnt-warmed/#more-75408(Follow the link above to view Fuller's graphs) The physics behind the theory of global warming are solid. CO2 is a greenhouse gas, we’re emitting industrial levels of it, with China now in the lead for emissions. A significant portion remains in the atmosphere for a fairly long time, though the residence time is widely disputed. This residence of CO2 retards the cooling of the Earth and temperatures warm as a result. One of the few non-controversial datasets in climate change is the Keeling curve, the graph of the concentrations of CO2 in the atmosphere.  We see concentrations rising steadily from 315 parts per million in 1960 to 395 ppm last year. It’s close to 400 ppm now. Human emissions of CO2 caused by burning of fossil fuels and production of cement have risen similarly. Emissions have climbed at an even higher rate than concentrations. And the third data source to look at (for simplicity’s sake–we could actually look at dozens of data sources) is temperature changes. This shows a fairly constant rise in temperatures since 1978. (edit - or maybe not according to UAH - but never mind, let's continue!) 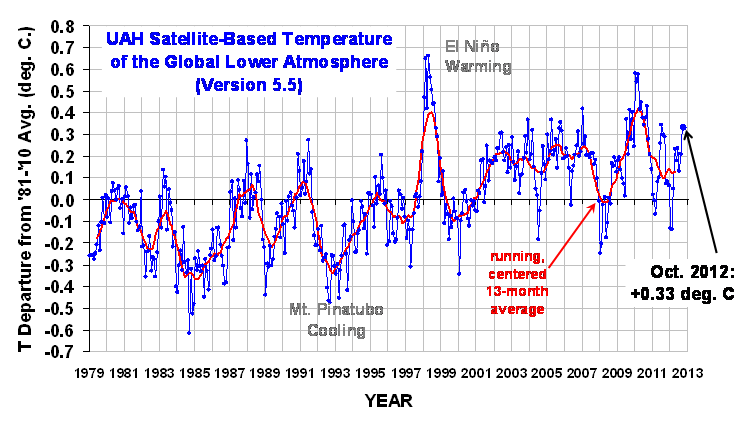 Once again, you don’t have to be a climate scientist to think that there seems to be a connection. The physical theory published first by Svante Arrhenius over 100 years ago and elaborated on by a century’s worth of scientists has observational evidence that tends to confirm it. I certainly believe in it. In fact, I believe that global temperatures will probably rise by about 2 degrees Celsius over the course of this century. The difference in estimated temperature rises from different sources almost always comes from the differences in estimated atmospheric sensitivity to concentrations of CO2 in the atmosphere. Having extra CO2 in the atmosphere warms the atmosphere, which is presumed to produce more water vapor, which is also a greenhouse gas and would contribute more warming than the CO2 by itself. How much extra warming would ensue is pretty much the heart and soul of the debate over global warming. Those who think that there isn’t much of an additional effect (that sensitivity of the atmosphere is low) have been chuckling very publicly because temperatures haven’t risen very much (if at all) since the big El Nino year of 1998. This is not hugely surprising, as the shape of the data is uneven, a sawtooth with ups and downs that can last a decade or longer. But it is happening at an inconvenient time politically for those who are worried that sensitivity is high. They are trying to get the world to prepare for warming of 4.5C or higher, without much success. By itself, this chart doesn’t explain very much. As I said, it is not uncommon or unexpected for the temperature record to have flat or declining periods that last a decade or more. However, I have a problem. The Carbon Dioxide Information Analysis Center (CDIAC) has estimates of how much CO2 humans have emitted since 1750. (Confusingly, they convert the CO2 to tons of carbon with a fixed formula.) That chart is the first one way up there at the top of the post. It rises dramatically But looking at the data global.1751_2009 (3), one thing jumps out at me. CDIAC writes “Since 1751 approximately 356 billion metric tonnes of carbon have been released to the atmosphere from the consumption of fossil fuels and cement production.” And they helpfully provide an Excel spreadsheet showing their estimates by year. And almost one-third of that number, 110 billion metric tonnes, have occurred since that time in 1998 when temperatures reached their temporary plateau. Table CO2 emissions yearly, million metric tonnes - data CDIAC Year........................CO2 1998.......................6644 1999.......................6611 2000.......................6766 2001.......................6929 2002.......................6998 2003.......................7421 2004.......................7812 2005.......................8106 2006.......................8372 2007.......................8572 2008.......................8769 2009.......................8738 Because heat moves somewhat sluggishly through the earth’s oceans, and because there is a lag factor in other earth systems, we do not expect a hair-trigger reaction to increases in CO2 emissions and concentrations. But one-third of all human emissions of CO2 have occurred since 1998. And temperatures haven’t budged as a result. This does not ‘disprove’ global warming–at all. I still believe that temperatures will climb this century, mostly as a result of the brute force effect of the 3,000 quads of energy we will burn every year starting in 2075–the reason I started this weblog. However it makes it exceedingly difficult to use the past 15 years as evidence of a very high sensitivity of the atmosphere to CO2 concentrations. And it makes me feel more comfortable about my ‘lukewarm’ estimate of 2C temperature rises as opposed to the more alarming 4.5C rises put forward by some of those who are most active in the movement to reduce emissions drastically. And it makes me wonder about why people don’t include relevant data when they discuss these issues. Is it really that politically incorrect to show real data, even if that data doesn’t advance your case? Tom Fuller blogs at: 3000Quads and is co-author with Steve Mosher of the CRUTape Letters.
|
|
|
|
Post by alancalverd on Dec 8, 2012 3:25:29 GMT 1
Actually, it's the dominance of "CO2 physics" that is really in dispute.
The Martian atmosphere consists almost entirely of CO2 with very little water. If CO2 were the dominant greenhouse gas, with a forcing function as derived from a CO2-driven model of recent climate change on Earth, Mars would be a lot hotter than it is. The conclusion, then, must be that the model is wrong.
The effect of water in the earth's atmosphere defies simple modelling because it exists in all three states (with enormous latent energy transfers between states), several macroscopic forms of the solid and liquid state (consider the effect on surface heating and convection, of the same quantity of water distributed in 1 okta cumulus cloud cover compared with 8/8 high cirrus) and enormously variable concentrations from antarctic dry to tropical saturation.
If we just start from the simplest model that sunshine evaporates water that forms clouds that cut then off the sunshine and trap surface heat, it's pretty obvious that the total atmospheric concentration of water is a bounded chaotic oscillator, even if we don't consider the different heating and evaporative properties of sea water, ice, and wet land. Surface temperature must therefore also be a chaotic oscillator. And that is exactly what we observe over short and long periods on Earth. But not on Mars!
Now the concentration of CO2 in the atmosphere depends on biological activity (yes, humans are biological!). If it is cold (and therefore sunny), plants grow faster than insects can eat them and the CO2 concentration decreases. Insect activity increases as the temperature rises, so more plant material is converted to CO2. You can see this in the annual sinusoidal behaviour of CO2 concentration at sites such as Mauna Loa, which also shows that "natural" activity (more CO2 in summer) far outweighs the anthropogenic contribution (that would generate more CO2 in winter). Thus there is a pre-human historic correlation between atmospheric CO2 and temperature, but (a) the graphs will be chaotic and (b) the temperature graph will lead the CO2 graph. Which is exactly what we observe in ice cores.
This last point is the clincher. In both science and common sense, if A precedes B, B cannot be the cause of A.
Ah, but what about human activity? The answer is that we can't tell from present data whether fossil fuel burning has had any significant effect on climate because we have no reason to believe that the recent correlation is causative. If we reduced CO2 emissions and the temperature decreased, we could begin to suspect some causation, but a short-term unilateral correlation between an inherently chaotic trend and an intentional variate is as likely as not to be chance, and for as long as temperatures remain stable whilst anthropogenic CO2 increases, the likelihood of CO2 being the prime forcing agent will decrease.
|
|
|
|
Post by mrsonde on Dec 8, 2012 4:39:31 GMT 1
It's already beyond dispute that CO2 is not the prime forcing agent of global warming - or any other greenhouse gas. From a variety of sources it's now clear that the temp rise since c1800 is at least, to be conservative, 60% due to increased solar activity. Even the best climate models (best in terms of hindsight reconstruction) used by the IPCC attribute 50% of temperature anomaly to sunspot cycle length (though at a 75% attribution the hindsight runs are more successful - go figure.) Solar activity does not mean solar irradiance; the two are linked in some way, but it's still far from clear exactly how. In any case, that has an effect of its own, though it's still much in dispute to what extent: the general consensus seems to be anywhere between 0.1 and 0.3 degrees of the last century's c0.8 degree rise is down to increased sunshine. Nor is it at all certain how sunspot and coronal activity - ultimately deriving from the sun's dynamo - exactly influences the earth's climate. The sunspot and global temperature datasets, and the indisputable link correlation between them, are however reconstructable from geomagnetic data.
So, just these two causative factors together account for well over three quarters of the observed global warming since the Little Ice Age, including, most signficantly, the rapid rise between the mid-70s and the early noughties. That leaves a possible 0.2 degrees that might be due to something else, like increased atmospheric CO2. This figure is generally about the accepted margin of error in global temperature measurements, over the past 150 years. So it's entirely possible that there's no effect of CO2 on temperature at all, due to the various feedback effects of cloud cover, increased plant respiration, and so on. But if there is a genuine effect, it's a negligible one - an at most a fifth of a degree rise in a century.
This is not to say it's not a good idea to start reducing our carbon emissions and pollution in general, of course. At about 2,000 ppm CO2 becomes toxic to plants, and a bit of extra heat will be the least of our worries. But long before the human species could ever have emitted that much CO2 - two or three centuries at least - it's inconceivable that anyone would still be burning fossil fuels in any appreciable quantity. We're at most a decade from industrial production of electricity from splitting water using sunlight - my guess is three years, judging from the scientific progress on the problem so far. That's more or less free electricity for everyone, with no pollution whatsoever, and a by-product of desalinated water from the seas.
The hundreds of billions - trillions by now, probably - of dollars spent so far on this carbon-reduction gravy-train have therefore been a complete waste of money. And it was always obvious to any objective analysis that it would be. If the world's leaders and concerned environmental campaigners had ever been serious in their avowed beliefs, they wouldn't have been lobbying for inefficient windmills - they'd have been lobbying for a slashing of the meat trade (the increase in cattle on the planet since the 70s, with all the methane they emit, is another factor that eats into the above possible margin left for CO2 as a causative factor in global warming), an emergency nuclear power station building programme, and a Manhattan Project scale funding of the water-splitting problem. But then people like Al Gore wouldn't have made a hundred million from his carbon credit trading company.
|
|
|
|
Post by marchesarosa on Dec 8, 2012 10:16:22 GMT 1
Thanks, Messrs Calverd and Sonde.
|
|
|
|
Post by alancalverd on Dec 8, 2012 10:28:01 GMT 1
For what it's worth, farm animals emit around 25% of all anthropogenic CO2, never mind the methane. And humans emit 10% of the total.
The psychopolitical problem is that, like vehicle speed, CO2 is measurable, whereas "danger" or atmospheric water content is not. Measurability confers a presumed authority - it's "scientific" so it can and must be controlled. "Safety cameras" will prosecute you for driving safely past at 80 mph but not for killing a pedestrian at 29 mph.
And if it's measurable, it's taxable.
|
|
|
|
Post by marchesarosa on Dec 8, 2012 12:52:25 GMT 1
The alarmists seem alarmed that Co2 concentration reached a record level this year!
Since we are burning ever more fossil fuel (and have ever more animals farting, and ever more people inconveniently breathing and farting) isn't that pretty much a foregone conclusion?
Still I suppose it makes a nice scary headline!
|
|
|
|
Post by principled on Dec 8, 2012 15:22:34 GMT 1
|
|
|
|
Post by mrsonde on Dec 8, 2012 16:41:09 GMT 1
For what it's worth, farm animals emit around 25% of all anthropogenic CO2, never mind the methane. And humans emit 10% of the total. True indeed - but my general point was: why "never mind" the methane? Its global warming potential is usually considered to be 25 as much as that of CO2 over a century. In the short term, it's very much worse - in the lifetime of an livestock animal, about 75 times as much. Methane doesn't hang around for so long, but that's hardly relevant, given that livstock are replaced, and their overall numbers continue to rapidly rise (by nearly 5% a year now), and are projected to increase that rapid rise as the developing world catches up with American-style eating habits. Since 1750 the atmospheric content of methane has increased by 150% and, unlike the CO2 bogeyman, genuinely does have a lurking tipping-point timebomb in the runaway potential of vast reserves of it trapped in permafrost. So why isn't all the green hoohah about the catastrophic dangers of methane production, given that it's so much more an immediate threat than CO2? Why are people apparently happy to pay a huge subsidy through their energy bill for the ridiculous windmill scam, and then stuff their freezers full of meat? Sneer at SUV owners, but consider vegetarians a bit cranky? No one wants to take on the meat industry, that's why. Or give up their steaks and big macs. Or tell the Chinese and Indians they really ought to keep on eating rice and beans, like we've decided to do. Yes, the audible salivation of the West's politicians at this inexhaustible new source of revenue is one of the most repugnant aspects of this whole global warming scandal. And it will be looked back upon as a scandal, after the next ten years or so of increasing global cooling, despite bugger all having been done to reduce worldwide CO2 emissions. After thirty years of it the whole debate will primarily be analysed in terms seeing it as the greatest instance in history of mass hysteria; or propagandistically induced electoral manipulation; or of the dangers of the politicisation of the scientific establishment; or the supine and appallingly lazy nature of journalism; or, perhaps most incisively, in terms of the dangers inherent in allowing one particular range of psychologically determined socio-political temperament gaining such a disproportionate degree of control over the levers of power. More positively, I'm sure it will also be viewed in terms of the incalculable liberation for information and thought brought about by the internet. Marchesarosa will become a folk hero! Better start dressing in Lincoln Green now. |
|