|
|
Post by clh on Jun 16, 2011 22:49:52 GMT 1
The IPCC predictions presented in the graph at the top of this page are not from the 1990 IPCC report, but have been calculated based on the report. Whether that has been done correctly I have doubts. It turns out that is unnecessary because thanks to a digitization effort the 1990 IPCC report is online. The temperature projections are in this document: www.ipcc.ch/ipccreports/far/wg_I/ipcc_far_wg_I_annex.pdfHere are the best estimate future temperature projections from the 1990 report from figure A9: 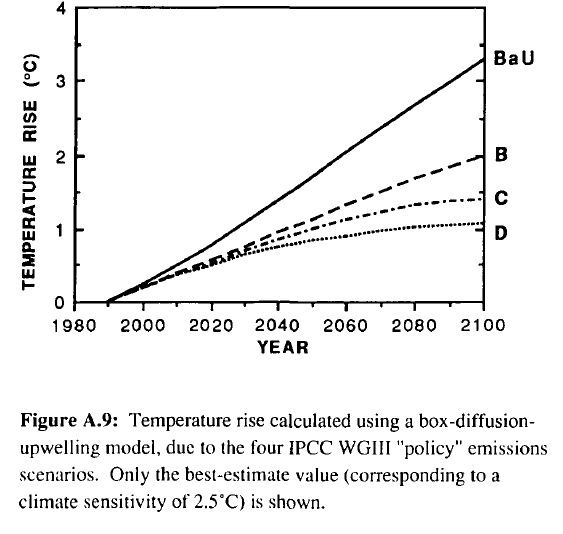 The different lines represent different future greenhouse gas scenarios. The top line labeled BAU was predicated on CFC levels rising fast to 2011. This did not happen, CFCs were phased out. The scenario that best matches what did happen is one of the lower ones (and they are all so close by 2011 that it makes little difference which) Here is the relevant part of figure A9 from the IPCC report superimposed over the graph at the top of this post: 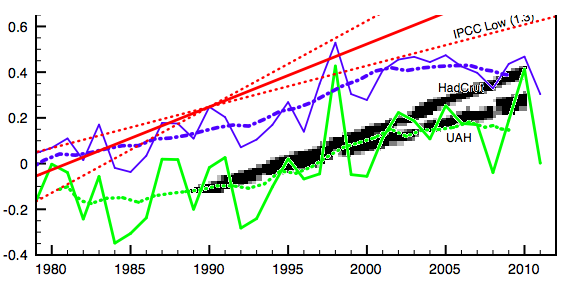 |
|
|
|
Post by marchesarosa on Jun 17, 2011 10:02:24 GMT 1
In fact the Business as Usual scenario, far from being rejected, should be the only logical one to consider since CO2 increases have continued merrily upward at a linear rate of increase according to Mauna Loa data.
All 4 "policy" scenarios in your table A.9. take "climate sensitivity" to be 2.5C degrees.
For the uninitiated this means temperatures are predicted to rise 2.5C degrees for a DOUBLING of Co2 concentration.
This assumption seems wrong when compared to the actual temperature change already experienced since the prediction was made. It contains a large element of "enhancement" via supposedly "positive" water vapour feedback that purportedly exaggerates the somewhat puny independent CO2 effect.
Boils down to the fact that the IPCC made exaggerated claims about what the temperature would do under Business as Usual conditions. It was just scare-mongering and its "scenarios" are not, so far, matching reality.
The world is still very much in "Business as Usual" emissions mode - even more so in the case of India and China and others!
|
|
|
|
Post by clh on Jun 17, 2011 20:01:16 GMT 1
I am surprised you think you can so easily dispense with the BAU (BUSINESS AS USUAL) scenario. It's not surprising. It didn't happen. Both CFC and methane projections in this scenario fell short. In fact if anything actual emissions have fallen short of all the scenarios on that graph. CFCs are not created in nature, man is the only known source. In the business as usual scenario CFC-11 increases to over 400ppt by 2011 and CFC-12 increases to over 700ppt. But due to the CFC phase out the actual levels of CFC-11 and 12 in the atmosphere have falled far short of that:  In fact CFC levels are even lower than the lowest scenarios on the graph. The business as usual scenario also has methane increasing to over 2200ppb by 2011, but again what has actually happened falls short. Even CO2 is slightly ahead in BAU (but only by a few years). The BAU scenario is definitely the wrong comparison to make with recent temperatures. A more accurate test of the 1990 IPCC predictions would be against one of the lower scenarios (it doesn't matter which given they don't spread out until after 2011). From what I can see in the overlay the 1990 IPCC projections have therefore done very well. It's interesting to note that if the IPCC had used a climate sensitivity of just 1C per doubling of CO2 in their projections, the prediction would have fallen short of the warming that has occurred. |
|
|
|
Post by clh on Jun 18, 2011 11:58:42 GMT 1
The paper provides the radiative forcing of greenhouse gases used in the BAU prediction. 4wm-2. The actual radiative forcing (taking into account HFCs) is lower than this (about 3wm-2): 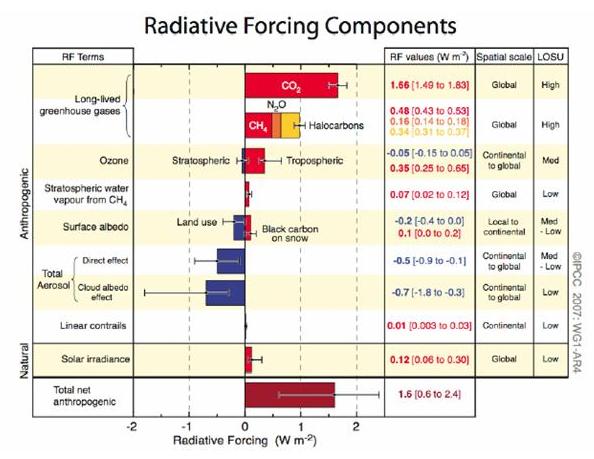 This does indeed follow more closely the lower scenarios of about 0.4C warming since 1990 |
|
|
|
Post by marchesarosa on Jun 18, 2011 21:41:23 GMT 1
Did they forget to explain to you, clh, that CO2 is only a tiny fraction of the so-called Greenhouse gases? 95% of it is water vapour. Where does that leave your CO2 "forcing"? I don't see any water (H2O) vapour in your nice diagram. www.geocraft.com/WVFossils/greenhouse_data.html |
|
|
|
Post by clh on Jun 19, 2011 0:29:07 GMT 1
The diagram depicts forcings not greenhouse gases. Solar irradiance is on there for example, that's not a greenhouse gas. Water vapor is not a forcing, that's why it's not on the diagram.
When the world warms, average humidity increases and so the amount of water vapor increases. As you point out (although the figure 95% is wrong) water vapor is a strong part of the greenhouse effect, so when humidity does increase that will warm the planet even more. That's one reason why so much global warming is expected.
|
|
|
|
Post by StuartG on Jun 19, 2011 9:29:44 GMT 1
 "The term “radiative forcing” has been used in the IPCC Assessments with a specific technical meaning, to denote an externally imposed perturbation in the radiative energy budget of Earth’s climate system, which may lead to changes in climate parameters.[1] The exact definition used is: The radiative forcing of the surface-troposphere system due to the perturbation in or the introduction of an agent (say, a change in greenhouse gas concentrations) is the change in net (down minus up) irradiance (solar plus long-wave; in Wm-2) at the tropopause AFTER allowing for stratospheric temperatures to readjust to radiative equilibrium, but with surface and tropospheric temperatures and state held fixed at the unperturbed values.[2] " Here's a quote from 'Realclimate' where a chap called Gavin says, speaking of Roger Pielke Sr. "In it, he has made clear that he feels that apart from greenhouse gases, other climate forcings (the changes that affect the energy balance of the planet) are being neglected in the scientific discussion. Specifically, he feels that many of these other forcings have sufficient ‘first-order’ effects to prevent a clear attribution of recent climate change to greenhouse gases. " Gavin waffles on a bit but that much is clear. www.realclimate.org/index.php/archives/2005/09/what-is-a-first-order-climate-forcing/the beginning of Wiki says... "In climate science, radiative forcing is loosely defined as the change in net irradiance at atmospheric boundaries between different layers of the atmosphere, namely the troposphere and the stratosphere (the tropopause)." en.wikipedia.org/wiki/Radiative_forcing#IPCC_usage'forcing' is a glib term bandied about by people, it's exact interpretation is down to the author. StuartG |
|
|
|
Post by louise on Jun 19, 2011 9:42:55 GMT 1
|
|
|
|
Post by StuartG on Jun 19, 2011 10:03:58 GMT 1
I was quoting from a different article...Please note the different addresses.
StuartG
|
|
|
|
Post by louise on Jun 19, 2011 10:11:23 GMT 1
I was quoting from a different article...Please note the different addresses. StuartG I did notice that but my point was that if you are going to quote Gavin and a Realclimate article to show how he uses the word 'forcing' then it is probably best to refer to an article whose purpose is to address that point (rather than his opinion of somebody else's view). |
|
|
|
Post by StuartG on Jun 19, 2011 10:16:43 GMT 1
... Stratospheric Water Vapour Attachments:
|
|
|
|
Post by Joanne Byers on Jun 19, 2011 11:35:51 GMT 1
Please keep to the subject of the thread. This thread is about temperature.
I have moved posts about ozone to the Ozone Hole thread.
New members should acquaint themselves with debates already covered on this sub-board board. There are already links provided and diagrams etc concerning ozone.
This board tries to keep some order amongst the postings so there are long-lived threads devoted to several common themes concerning climate. Please use them.
A proliferation of posts duplicating the same debates on different threads is not helpful.
thankyou
|
|
|
|
Post by marchesarosa on Jun 19, 2011 14:39:27 GMT 1
The false distinction between "forcings" and "feedbacks" is at the heart of the AGW debate.
clh should inform herself about this difference of opinion between scientists.
The fact that there has been an increase in CO2 from fossil fuel does not make it into a new independent "forcing". Nature cannot tell the difference between sources of CO2 - it all goes onto the same pot and it is all recycled in the same way.
Nothing special about fossil fuel CO2 AT ALL - except the politicking.
And water vapour is the great ignored variable in so-called "greenhouse" forcing. Aquaint yourself with the threads and posts about clouds and albedo, perhaps?
|
|
|
|
Post by marchesarosa on Jun 19, 2011 14:45:54 GMT 1
I am copying this statement here because it is relevant to greenhouse gases.
HFCs replaced HCFCs, which in turn replaced CFCs, thanks to the Montreal Protocol of 1987. This succession of chemical refrigerants has reduced ozone-destroying potential; but unfortunately they are all GH gases. So now HFCs must be eradicated, because a single molecule of HFC produces many thousand times the greenhouse effect of a molecule of CO2. What they don't tell you, of course, is that the total forcing from the HFCs is less than one percent of that of CO2, according to the IPCC (see page 141). - Fred Singer.
|
|
|
|
Post by eamonnshute on Jul 5, 2011 15:11:19 GMT 1
The recent lull in global warming has now been explained, paradoxically, by the recent rapid increase in coal burning by China. This has produced a lot of sulphate aerosols which have a cooling effect. However, this effect is likely to be temporary - these aerosols only have a short lifetime in the atmosphere, and if China takes measures to deal with them the warming will resume its upwards trend. www.bbc.co.uk/news/science-environment-14002264 |
|


